Dynamic dataviz generated with R as an embed code
2019-10-13Rframe: a WordPress plugin to embed the HTML generated with R.
How to embed within a post (or a page) a dynamic dataviz whose HTML code was generated with R? The « Rframe » plugin allows you to answer the question in the easiest way. This plugin is available in FR and in EN.
Update V0.2: shortcode and dynamic view added
Plugin installation
1) Download the plugin on Github
2) Add it to your WordPress’ plugins
3) Activate it, a new post type « Rframe » will appear in the menu
Tutorial
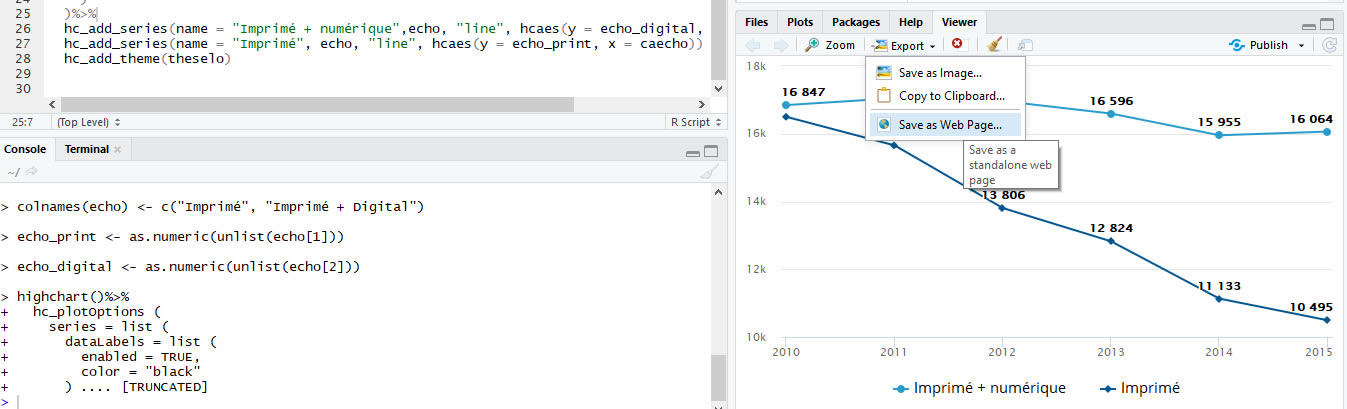
1) In R Studio, export the dataviz : Export / Save as web page
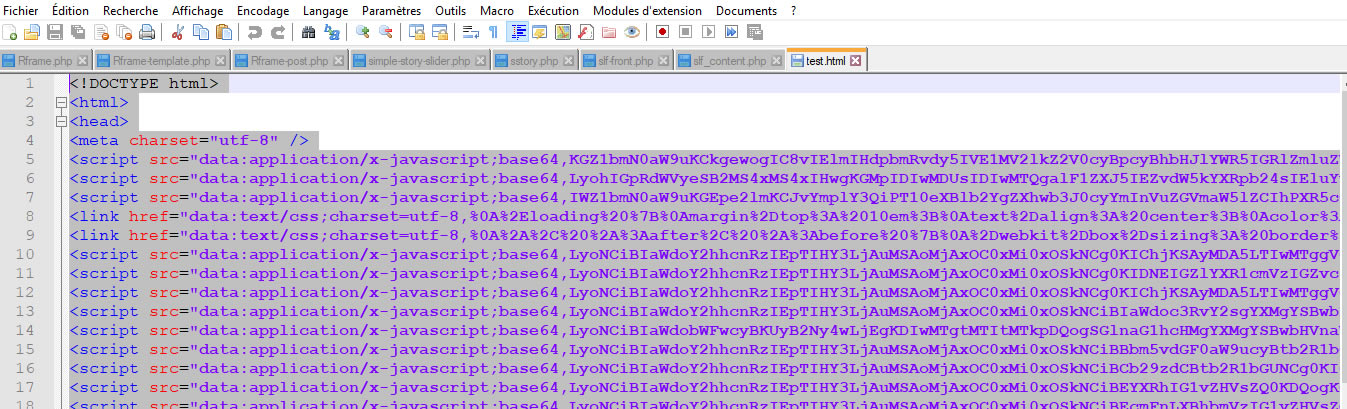
2) Open the HTML file in a code editor, select all (CTRL + A) and then copy (CTRL + C)
3) Create a new post « Rframe » in WordPress
4) Add a title
5) Save the post
6) Copy the shortcode
7) Create a new post and paste the shortcode
You can change the width of the rframe within the shortcode (by default, 100%).
The example below is based on the the package Highcharter.
Admin preview
